It's been a while since our last diversity report. In fact, we only ever had that one for SCALE 14x. We did write another for 17x, but it never made it past draft form. But that's OK, we have all the data! One of the exciting things about starting to track this data was building historical data: are we doing better or worse over time? Here's some trends. You'll recall from last time that we started with gender data as we wanted to pick one axis to start with and grow from there. Gender is, for sure, not the only area of diversity and inclusion that are critical to focus on in tech. That said, it's the one we started with, so let's look at the data.
Submissions and Speakers
The most relevant graph, IMO, is percentage of acceptances by gender. That is, for any given gender, what is the percentage of those submissions that were accepted. This is obviously different from percentage of total acceptances for a given gender, but it isolates the variable of submission rate to only look at general fairness of the review process.
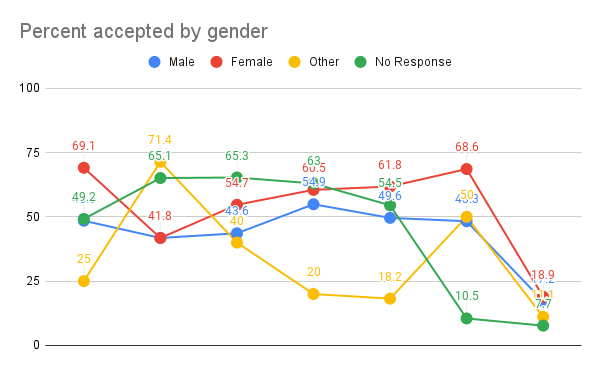
NOTE: This year (20X) data is still in-progress, so the numbers look quite different and are much smaller.
What we can see here is that the acceptance rate of those identifying as Male and Female is usually within 5%, sometimes 10% of each other, and is always higher for women. No response fairs similarly, though it took a pretty big dive in 19X. This appears to be due to submissions from authors identifying as No response dropping off dramatically compared to overall submissions on our off-year SCALE (last year was in September): overall submissions were down almost 40%, but "no response" went down almost 60% to their lowest point ever. However, it appears to be an anomaly of our delayed off-cycle year since the numbers seem to be trending back in line with other genders this year.
So isolating for fairness through the review process looks pretty good, but that isn't the whole story. What about getting into the process? The rate at which different communities submit talks can be a symptom of how welcoming your community is and therefore is also important to track. The following two graphs show the overall submissions by gender and the overall acceptances by gender.
.png)
.png)
Obviously these two graphs are effectively just source data for the first graph. The biggest take-away that I get from them is that there hasn't been a significant change in submissions, though there has been a slight increase in submissions from women and a slight decrease in those identifying as other or who chose not to respond.
One potentially confusing thing here: the first graph and the third graph - what's the difference? They have nearly identical titles. The first graph is, for each gender, what was their acceptance rate. In other words, it is the ratio of acceptances to submissions for each reported gender. The third graph is, given the accepted talks, what percentage of them is from a given reported gender. In other words, it looks at the gender breakdown of only accepted talks.
Attendees
Now let's look at attendees. This doesn't include 20x data as we won't have usable data on our attendees until after the conference. But like the above graphs, it starts at 14x and shows the trend.
.png)
The trend here is pretty similar: Not a ton of change over the years, but 19X appears to be an anomaly with No response dropping noticeably (about 4%) and a pickup in those identifying as Male or Female (each rising about 2%). All indications are that this was an anomaly and I hope that will be borne out by the 20X numbers.
Final Thoughts
As we mentioned when first announced this initiative, it's a little hard to know what "good" looks like without knowing where we stand and we hope to see more diversity data from other conferences in order to have a better picture of where we're succeeding vs falling behind. In the last few years we've continued to focus on creating an inclusive and safe environment in a variety of ways including rolling out a Safety number (posted all around the conference) that can reach someone 24/7 during the show in case of anyone feeling uncomfortable, experiencing/witnessing anything inappropriate, etc. We look forward to expanding this diversity data to other axes and to finding additional ways to enthusiastically welcome people of all genders, races, ages, and backgrounds in our community.